A brain map is one of the most powerful conversations a care provider can have with a client, and most of that power is wasted if the map only stays on the clinician’s screen. A good map does two jobs at once: it gives the practitioner an objective starting point for a training plan, and it gives the client a picture they can actually understand of why they feel the way they feel. This article walks through how we read brain maps at Divergence Neuro, what the absolute and relative views each reveal, and how clinics can turn those colorful heads into better client communication, stronger buy-in, and clearer proof of progress.
What a brain map actually is
A brain map, or quantitative EEG (qEEG), takes a few minutes of recorded brainwave activity and turns it into a set of topographic images. We record the EEG, clean out artifacts like blinks and muscle tension, run a frequency analysis on the clean signal, and then plot the result as a color image of the head seen from above. The nose points up, the ears sit left and right, and warmer or cooler colors show where a given type of brainwave is stronger or weaker than expected.
The frequency analysis is the heart of it. A raw EEG trace looks like a single squiggle, but it is really many rhythms layered together. A Fast Fourier Transform separates that blended signal into its component frequencies, the same way a prism splits white light into a rainbow, producing a power spectrum that shows how much electrical power the brain is producing at each frequency (Keller, 2026). We then group those frequencies into the standard bands clinicians have studied for decades: delta (slow, associated with deep rest), theta (drowsy, internally focused states), alpha (relaxed wakefulness), beta (active thinking and alertness), and gamma (fast, high-level processing).
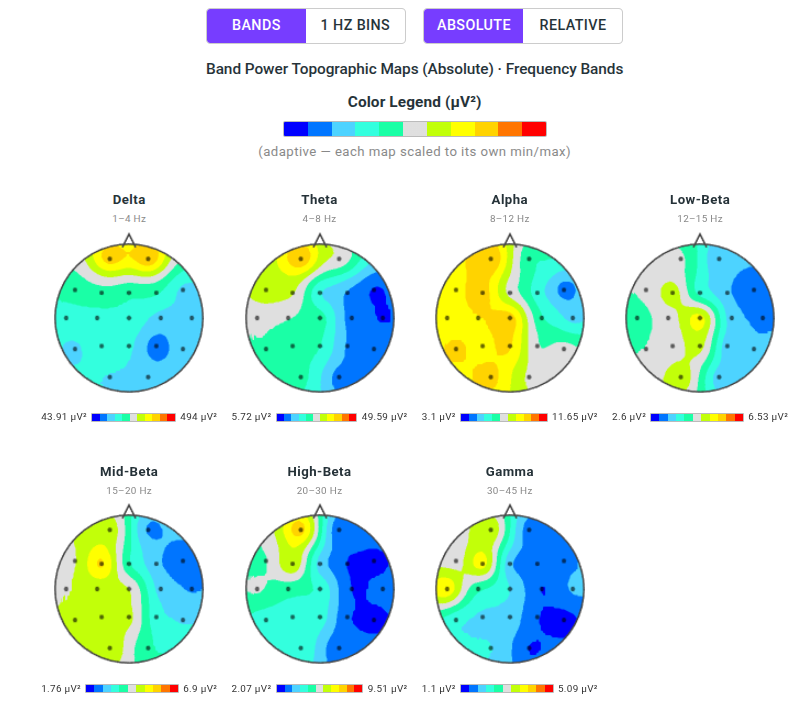
For every electrode and every band, the software calculates two numbers that matter for reading the map: absolute power, the total raw amount of activity in microvolts squared, and relative power, the percentage of total activity that falls in that band (Keller, 2026). Those two numbers produce two different maps of the same recording, and knowing how they differ is the key to reading either one well.
Absolute versus relative: two views of the same brain
This is the distinction that trips up new readers, so it is worth being precise. Absolute power indexes the raw amplitude of the oscillation, while relative power expresses each band as a proportion of the whole signal (Sandre & Troller-Renfree, 2026). Think of a household budget. Absolute power is how many dollars you spent on groceries. Relative power is what percentage of your total spending went to groceries. Both are true, and each answers a different question.
The absolute map answers “how much of this rhythm is the brain producing?” It is sensitive to the overall energy of the signal. The relative map answers “what is the brain’s activity made of?” Because it normalizes each band against the total, relative power is often assumed to control for non-neural variability such as hair texture or differences in scalp contact (Sandre & Troller-Renfree, 2026). That assumption is useful but not absolute. Recent work shows relative power dampens some amplitude-related noise yet does not universally correct for non-neural or state-related variability, so the field increasingly recommends reading both views together rather than choosing one (Sandre & Troller-Renfree, 2026).
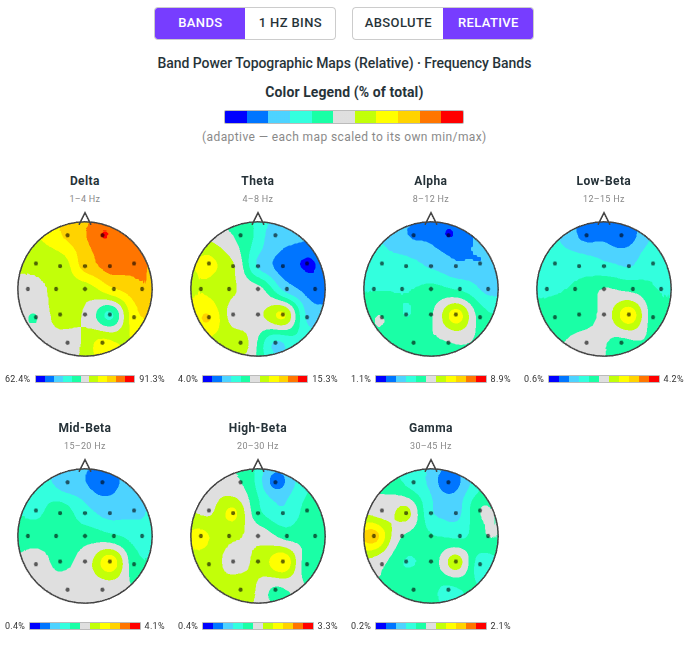
In practice the two views catch different things. A relative map will flag a brain that is proportionally heavy in slow theta even if its overall amplitude looks ordinary, which is exactly the kind of pattern that matters for attention and focus complaints. An absolute map will catch a genuinely high-amplitude region that a relative map might wash out, because when one band’s raw power climbs, every other band’s percentage drops to compensate. We read absolute and relative side by side for this reason. When both views agree, we have a robust finding. When they disagree, the disagreement itself is informative and tells us whether we are looking at a true excess of one rhythm or a redistribution across the spectrum.
How to read the map itself
The visual grammar is simpler than it looks. Once a client or a new clinician learns four things, they can read any map in the room.
First, the layout. Every head is shown from above with the nose up. Frontal regions sit at the top, occipital regions at the bottom, and left and right correspond to the brain’s hemispheres. There is usually one head per frequency band, so a full sheet might show a delta head, a theta head, an alpha head, a beta head, and so on.
Second, the color. Warm colors (reds and oranges) mean more of that band than expected, and cool colors (blues and greens) mean less. The scale is the part people skip and should not. Many clinical maps are z-score maps, meaning the color is not raw power at all but a comparison against a normative database of people the same age. On a z-score map, the middle of the scale is “typical for your age” and the extremes are statistical deviations, not good or bad in themselves.
Third, the comparison. The reason a brain map carries weight is that the recording is compared against a validated normative database. Recordings are processed through a normative database so the clinician can see how the client’s activity deviates from what is typical for their age group, much like a blood test compares a result against a normal reference range (Drake Institute, 2026). Without that comparison, a colorful head is just a colorful head. With it, the colors mean something specific.
Fourth, the condition. Maps are almost always recorded in at least two states, eyes closed and eyes open, because the brain behaves differently in each. Alpha should rise with eyes closed and drop with eyes open, and a map that does not follow that expected pattern is itself a finding.
What a therapist can tell from them
A brain map is not a diagnosis, and we are careful to say so. It is a functional snapshot. qEEG examines how the brain is functioning in real time, the way structural scans like MRI show what the brain looks like, and it is best treated as complementary to clinical observation rather than a standalone test (MaxWell Clinic, 2024). That caution matters: professional bodies have warned, for example, that a single ratio like theta to beta should not be used on its own to confirm an attention diagnosis. With that framing in place, here is what a skilled reader genuinely takes from a map.
A therapist can see regional patterns of over- and under-activity that line up with reported symptoms. In post-concussion cases, qEEG has identified consistent patterns such as increased frontal theta and delta power and a reduced alpha peak frequency (Keller, 2026), which is meaningful precisely because standard EEG and structural imaging are often normal after a concussion even when the person clearly is not functioning normally. In mood-related work, well-replicated qEEG features include frontal alpha asymmetry and altered theta and beta activity, with reported sensitivity in the range of 72 to 93 percent and specificity of 75 to 88 percent across large samples (Kanda et al., 2017), though the same review urges caution in generalizing because so many conditions overlap.
The therapist also reads relationships, not just hotspots. They look at whether the eyes-closed to eyes-open transition behaves normally, whether the two hemispheres are balanced, and whether the proportions across bands make sense for the person in front of them. A real clinical example illustrates the move from map to plan: a qEEG that revealed an overabundance of fast spindling beta, a sign of an over-activated brain that struggled to filter distractions, relax, and sleep, guided a targeted training plan, and a follow-up map later showed reduced spindling beta correlating with better concentration and sleep (Chandra, 2026). That is the core value for a practitioner. The map turns a vague complaint into a specific, locatable, trackable target.
Most importantly, a map tells the therapist where to aim. In neurofeedback the map pinpoints which frequencies to train, where to train them, and how to measure improvement (The Insight Clinic, 2023). It replaces one-size-fits-all protocols with a plan built around the individual brain, which is the difference between guessing and targeting.
Two more features worth knowing: peak alpha frequency and signal complexity
Absolute and relative power are the foundation, but two further measures add depth to a map, and both are easy to track over time. We surface them because they answer questions that band power alone cannot.
Peak alpha frequency
Band power tells you how much alpha there is. Peak alpha frequency, sometimes called individual alpha frequency or IAF, tells you where in the alpha range that activity peaks, that is, the exact frequency at which alpha power is strongest, typically somewhere between roughly 8 and 12 Hz. It sounds like a small detail, but it carries a lot. The individual alpha frequency reflects systemic properties of the brain, is highly heritable, and relates to cognitive functioning (Grandy et al., 2013), and a faster peak is generally associated with quicker information processing.
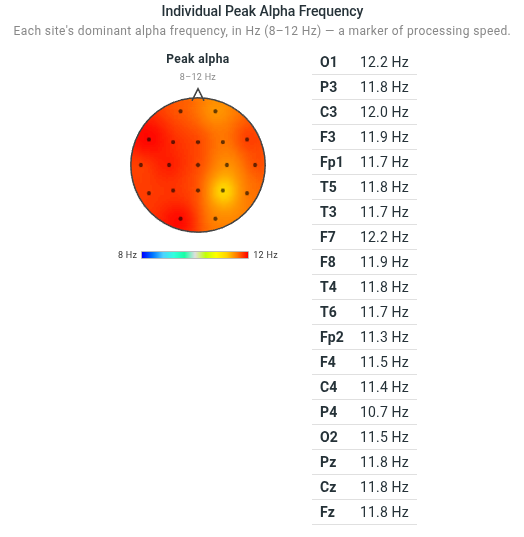
What makes it especially useful in a clinic is its behavior over a lifespan and within a person. Individual peak alpha frequency decreases with age and has been associated with worse executive function and working memory (Finley et al., 2024), and a slowed peak is one of the patterns seen after concussion. At the same time, peak alpha frequency is remarkably stable in a healthy brain. It qualifies as a stable neurophysiological trait marker that does not shift even after large gains in cognitive performance from training (Grandy et al., 2013), which is exactly what you want in a baseline. Because it is stable when things are healthy and shifts when something changes, it is well suited to within-person longitudinal tracking (Joffe et al., 2021). For a client, “your alpha peak moved back toward the typical range for your age” is a concrete, encouraging thing to be able to say.
Lempel-Ziv complexity (LZC)
Power and peak frequency describe the brain’s rhythms. Lempel-Ziv complexity describes how varied and unpredictable the signal is. LZC is a non-linear measure that quantifies the complexity of a time series such as EEG, capturing the degree of randomness, unpredictability, and informational richness in the signal’s structure (Bachmann et al., 2015). In plain terms, a low-complexity signal is repetitive and predictable, while a high-complexity signal is rich and varied.
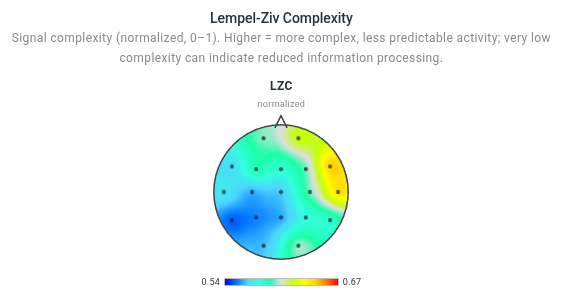
This turns out to track meaningful brain states. Signal complexity decreases in an orderly way from wakefulness down through the stages of sleep, making LZC a sensitive and robust marker of brain state (Höhn et al., 2024). It is also responsive to clinical change: in one study of depression, patients showed higher pre-treatment complexity that decreased after effective treatment, and the size of that reduction correlated with the degree of symptom remission, suggesting LZC may serve as an objective marker of depression and its recovery (Bachmann et al., 2015). Complexity measures have also been used to index the depth of altered states, which is part of why we find them relevant to emerging work in psychedelic-assisted therapy.
One honest caveat keeps LZC from being a simple “higher is better” gauge. Higher complexity can represent either a more genuinely complex system or a more random one, so it is not always the case that higher complexity means a healthier brain (Höhn et al., 2024). That is why we present LZC as one input among several and read it in the context of the rest of the map rather than in isolation. Used that way, it adds a dimension that band power simply cannot show.
How a clinic uses brain maps to communicate with clients
This is where most of the untapped value lives. The same image that guides the clinician is the single best tool a clinic has for client communication, and three uses stand out.
It builds understanding and trust at intake. Many clients arrive having tried things that did not work and are quietly skeptical that anything will. A brain map changes the conversation because it is concrete. Clients can see how their anxiety, attention difficulty, or mood pattern actually appears in the brain, and seeing one’s own brain activity creates a kind of psychological clarity that goes beyond the clinical metric (Höhn et al., 2024). When a client sees a warm patch over a region and hears it described in plain language, the abstract becomes visible. That shift from “I feel broken and I don’t know why” to “there is a specific, measurable pattern here, and we have a plan for it” is enormously reassuring, and reassurance drives follow-through.
It sets honest expectations and reduces wasted trial and error. A clinic that maps first can explain why a particular plan was chosen rather than asking the client to take it on faith. Starting from a brain map lets a clinic identify the most relevant strategy and avoid unnecessary trial and error, which makes the process more time- and cost-efficient for the client (MaxWell Clinic, 2024). Clients who understand the rationale behind their plan stay engaged with it, and engagement is the strongest predictor of outcome in any training program.
It proves progress with a before-and-after they can see. This is the most persuasive use of all. A brain map repeated at intervals lets the clinic show change rather than just assert it. Repeating the map at strategic points, for instance after a block of sessions, lets a clinic confirm improvements in brainwave activity, check that symptoms are resolving as expected, and adjust the plan for anything that remains (MaxWell Clinic, 2024). Placing the first map beside the latest one and watching the colors move toward the typical range is a powerful moment for a client. It validates the work they have put in, it justifies the cost, and it is exactly the kind of evidence that turns a satisfied client into a referral source.
Bringing it together
Absolute and relative maps are two readings of the same few minutes of brain activity. Absolute power tells you how much of a rhythm is present, relative power tells you what the brain’s activity is made of, and the most reliable insights come from reading them together against a normative comparison. For the clinician, that pairing turns a client’s words into a specific, trackable target. For the clinic, the very same images are the clearest, most trust-building way to explain the plan, set expectations, and prove progress over time.
At Divergence Neuro we built our Brain Maps so that both the absolute and relative views, in eyes-closed and eyes-open states, are easy to generate, easy to compare across sessions, and easy to put in front of a client. A map that lives only on the practitioner’s screen is a missed opportunity. A map shared well is the start of a better conversation, a more confident client, and a clearer path to results.
Frequently asked questions
Q: Is a brain map the same as an MRI or CT scan?
No. An MRI or CT shows structure, what the brain looks like. A brain map is functional. It shows how the brain is working in real time (MaxWell Clinic, 2024), which is why it can reveal patterns that structural scans miss, including the subtle changes that follow a concussion even when an MRI comes back normal.
Q: Does a brain map diagnose a condition?
On its own, no. We treat it as a functional snapshot that supports clinical judgment rather than replacing it. Individual measures should not be used in isolation to confirm a diagnosis. The map’s value is in locating patterns, guiding a plan, and tracking change, all alongside a clinician’s broader assessment.
Q: Is the recording safe? Does it hurt?
It is non-invasive and painless. The system only records the brain’s natural electrical activity, much like a thermometer reads temperature without changing it. The brain map records electrical activity for analysis and does nothing to the brain itself (Drake Institute, 2026). The client simply sits relaxed while a sensor cap picks up the signal.
Q: Why record with eyes open and eyes closed?
Because the brain behaves differently in each state and the comparison is itself informative. Alpha should rise with eyes closed and settle with eyes open, so a map that does not follow that expected pattern tells the clinician something useful.
Q: Should we look at the absolute map or the relative map?
Both. Absolute power tells you how much of a rhythm is present, relative power tells you what proportion of the whole it represents, and reading them together is more reliable than choosing one. When the two agree you have a robust finding, and when they disagree the difference itself is informative.
Q: Do clients need to understand peak alpha frequency and LZC?
Not in technical depth. These are interpreted by the practitioner. For the client, the point is the story the measures tell over time, for example a peak alpha frequency moving back toward the typical range for their age, or a complexity value shifting alongside how they report feeling. The numbers stay on the clinician’s side; the meaning is what gets shared.
Q: How often should a map be repeated?
Commonly at the start as a baseline and then at intervals through a program, such as after a block of training sessions. Repeating the map lets a clinic confirm improvements, check that symptoms are resolving as expected, and adjust the plan for anything that remains (MaxWell Clinic, 2024). The repeated map is also the before-and-after that clients find most convincing.
Brain maps are a functional assessment and communication tool intended to support, not replace, professional clinical judgment. Interpretation should always be performed by a qualified practitioner.
References
Bachmann, M., Kalev, K., Suhhova, A., Lass, J., & Hinrikus, H. (2015). Lempel Ziv complexity of EEG in depression. In I. Lacković & D. Vasić (Eds.), 6th European Conference of the International Federation for Medical and Biological Engineering (pp. 58–61). Springer. https://doi.org/10.1007/978-3-319-11128-5_15
Chandra, S. (2026). qEEG brain mapping: Visualize your brain, transform your mental health. Dr. Suruchi Chandra. https://chandramd.com/qeeg-brain-mapping
Drake Institute. (2026). What is brain mapping? Drake Institute of Neurophysical Medicine. https://drakeinstitute.com/articles/treatment-technology/what-is-brain-mapping/
Finley, A. J., Angus, D. J., Knight, E. L., van Reekum, C. M., Lachman, M. E., Davidson, R. J., & Schaefer, S. M. (2024). Resting EEG periodic and aperiodic components predict cognitive decline over 10 years. The Journal of Neuroscience, 44(13), e1332232024. https://doi.org/10.1523/JNEUROSCI.1332-23.2024
Grandy, T. H., Werkle-Bergner, M., Chicherio, C., Schmiedek, F., Lövdén, M., & Lindenberger, U. (2013). Peak individual alpha frequency qualifies as a stable neurophysiological trait marker in healthy younger and older adults. Psychophysiology, 50(6), 570–582. https://doi.org/10.1111/psyp.12043
Höhn, C., Hahn, M. A., Lendner, J. D., & Hoedlmoser, K. (2024). Spectral slope and Lempel–Ziv complexity as robust markers of brain states during sleep and wakefulness. eNeuro, 11(3), Article ENEURO.0259-23.2024. https://doi.org/10.1523/ENEURO.0259-23.2024
Joffe, D., Oakley, D. S., Lucini, F. A., & Palermo, F. X. (2021). Measurements of EEG alpha peak frequencies over the lifespan: Validating target ranges on an in-clinic platform [Preprint]. bioRxiv. https://doi.org/10.1101/2021.10.06.463353
Kanda, P. A. M., Anghinah, R., Smidth, M. T., & Silva, J. M. (2017). The clinical use of quantitative EEG in cognitive disorders. Dementia & Neuropsychologia, 11(4), 379–385. https://doi.org/10.1590/1980-57642016dn11-040010
Keller, A. (2026). What is QEEG? Quantitative EEG explained. Neurosity. https://neurosity.co/guides/what-is-qeeg-quantitative-eeg
MaxWell Clinic. (2024). Why brain mapping (QEEG) is essential for personalized neurofeedback treatment. https://maxwellclinic.com/why-brain-mapping-qeeg-is-essential-for-neurofeedback/
The Insight Clinic. (2023, March 27). What is brain mapping? The Insight Clinic. https://theinsightclinic.ca/what-is-brain-mapping/